About Event Viewer
Oracle Database for Windows problems and other significant occurrences are recorded as events in an application event log.
View and manage these recorded events in Event Viewer.
- Using Event Viewer
Learn how to use Event Viewer. - Managing Event Viewer
Learn how to manage Event Viewer. - Reading Event Viewer
Learn how to read an Event Viewer.
Using Event Viewer
Learn how to use Event Viewer.
To access Event Viewer:
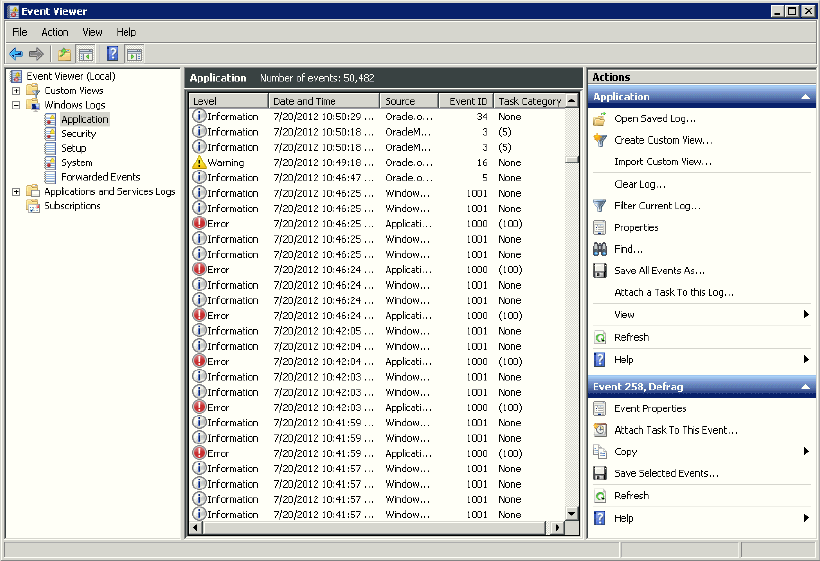
Application View Window displays the Application view window, Application View Definitions shows what is recorded in each column, and Event Viewer Icons interprets icons that appear on the left hand side of the viewer.
Table 7-2 Application View Definitions
| Column Name | Definition |
|---|---|
|
Date and Time |
Date and time at which an event took place |
|
Source |
Application that recorded an event |
|
Event ID |
Unique number assigned to an event |
|
Task Category |
Classification of events |
Table 7-3 Event Viewer Icons
| Icon | Event Type | Suggested Action |
|---|---|---|
|
Exclamation Point in Red Circle |
Error |
Error identification. Always check these icons. |
|
Lowercase "i" in Blue Circle |
Information |
Noncritical system events. Check these icons only to track a specific event. |
|
Exclamation Point in Yellow Triangle |
Warning |
Special events, such as instance termination or services shutdown. Investigate these icons, but they are usually noncritical. |
Managing Event Viewer
Learn how to manage Event Viewer.
Setting AUDIT_TRAIL to db or os causes more records to be written to Event Viewer. This can fill up the Event Viewer log file. Follow these procedures to increase log file size:
Reading Event Viewer
Learn how to read an Event Viewer.
Oracle Database for Windows events are displayed with a source of Oracle.SID.
Event number 34 specifies an audit trail event. These events are recorded if the parameter AUDIT_TRAIL is set to db (true) or os in the initialization parameter file. Option os enables systemwide auditing and causes audited records to be written to Event Viewer. Option db enables systemwide auditing and causes audited records to be written to the database audit trail (table SYS.AUD$). Some records, however, are written to Event Viewer.
Event numbers other than 34 specify general database activities, such as an instance being started or stopped.
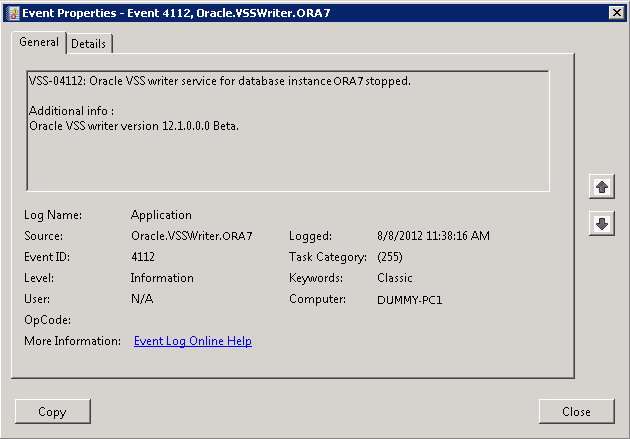
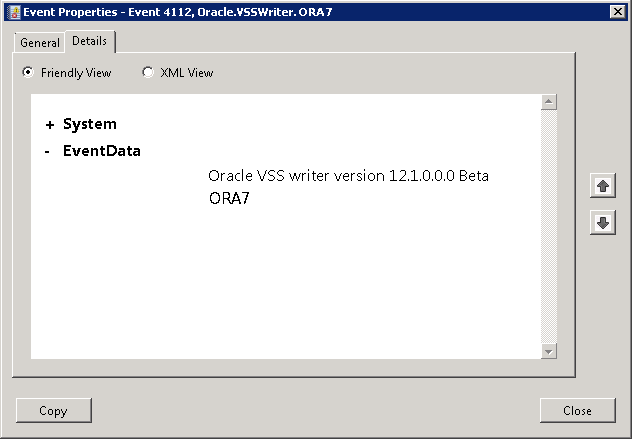
When you double-click an icon in Event Viewer, the Event Properties dialog box appears with more information about the selected event. Event Properties General Tab, for example, shows details about Event ID 4112. In the General tab, you find a text description of the event. In the Details tab, you can select Friendly View to see the System and Event Data in words or XML View to see the same information in XML format, as shown in Event Properties Details Tab.
See Also:
Microsoft operating system documentation for more information about using Event Viewer


