13 Analyzing Captured and Replayed Workloads
Note:
After the replay analysis is complete, you can restore the database to its original state at the time of workload capture and repeat workload replay to test other changes to the system once the workload directory object is backed up to another physical location.
13.1 Using Workload Capture Reports
Workload capture reports contain captured workload statistics, information about the top session activities that were captured, and any workload filters used during the capture process.
The following sections describe how to generate and utilize workload capture reports:
13.1.1 Accessing Workload Capture Reports Using Enterprise Manager
This section describes how to generate a workload capture report using Oracle Enterprise Manager.
The primary tool for generating workload capture reports is Oracle Enterprise Manager. If for some reason Oracle Enterprise Manager is unavailable, you can generate workload capture reports using APIs, as described in "Generating Workload Capture Reports Using APIs".
To access workload capture reports using Enterprise Manager:
13.1.2 Generating Workload Capture Reports Using APIs
DBMS_WORKLOAD_CAPTURE package. You can also use Oracle Enterprise Manager to generate a workload capture report, as described in "Accessing Workload Capture Reports Using Enterprise Manager".To generate a report on the latest workload capture:
-
Use the
DBMS_WORKLOAD_CAPTURE.GET_CAPTURE_INFOprocedure.The
GET_CAPTURE_INFOprocedure retrieves all information regarding the workload capture and returns thecap_idfor the workload capture. This function uses thedirrequired parameter, which specifies the name of the workload capture directory object. -
Call the
DBMS_WORKLOAD_CAPTURE.REPORTfunction.The
REPORTfunction generates a report using thecap_idthat was returned by theGET_CAPTURE_INFOprocedure. This function uses the following parameters:-
The
capture_idrequired parameter relates to the directory that contains the workload capture for which the report will be generated. The directory should be a valid directory in the host system containing the workload capture. The value of this parameter should match thecap_idreturned by theGET_CAPTURE_INFOprocedure. -
The
formatrequired parameter specifies the report format. Valid values includeDBMS_WORKLOAD_CAPTURE.TYPE_TEXTandDBMS_WORKLOAD_REPLAY.TYPE_HTML.
-
In this example, the GET_CAPTURE_INFO procedure retrieves all information regarding the workload capture in the jul14 directory and returns the cap_id for the workload capture. The REPORT function then generates a text report using the cap_id that was returned by the GET_CAPTURE_INFO procedure.
DECLARE
  cap_id         NUMBER;
  cap_rpt        CLOB;
BEGIN
  cap_id  := DBMS_WORKLOAD_CAPTURE.GET_CAPTURE_INFO(dir => 'jul14');
  cap_rpt := DBMS_WORKLOAD_CAPTURE.REPORT(capture_id => cap_id,
                           format => DBMS_WORKLOAD_CAPTURE.TYPE_TEXT);
END;
/
See Also:
-
"Reviewing Workload Capture Reports" for information about how to interpret the workload capture report
-
Oracle Database PL/SQL Packages and Types Reference for information about the
DBMS_WORKLOAD_CAPTUREpackage
13.1.3 Reviewing Workload Capture Reports
-
Represents the actual workload you want to replay
-
Does not contain any workload you want to exclude
-
Can be replayed
The information contained in the workload capture report is divided into the following categories:
-
Details about the workload capture (such as the name of the workload capture, defined filters, date, time, and SCN of capture)
-
Overall statistics about the workload capture (such as the total DB time captured, and the number of logins and transactions captured) and the corresponding percentages with respect to total system activity
-
Profile of the captured workload
-
Profile of the uncaptured workload due to version limitations
-
Profile of the uncaptured workload that was excluded using defined filters
-
Profile of the uncaptured workload that consists of background process or scheduled jobs
13.2 Using Workload Replay Reports
Workload replay reports contain information that can be used to measure performance differences between the capture system and the replay system.
The following sections describe how to generate and review workload replay reports:
13.2.1 Accessing Workload Replay Reports Using Enterprise Manager
This section describes how to generate a workload replay report using Oracle Enterprise Manager.
The primary tool for generating workload replay reports is Oracle Enterprise Manager. If for some reason Oracle Enterprise Manager is unavailable, you can generate workload replay reports using APIs, as described in "Generating Workload Replay Reports Using APIs"
To access workload replay reports using Enterprise Manager:
13.2.2 Generating Workload Replay Reports Using APIs
DBMS_WORKLOAD_REPLAY package. You can also use Oracle Enterprise Manager to generate a workload replay report, as described in "Accessing Workload Replay Reports Using Enterprise Manager".To generate a report on the latest workload replay for a workload capture using APIs:
-
Retrieve information about the workload captures and the history of the workload replay attempts from the replay directory object by calling the
DBMS_WORKLOAD_REPLAY.GET_REPLAY_INFOfunction, as described in "Retrieving Information About Workload Replays".The
GET_REPLAY_INFOfunction returns thecap_idof a single capture directory (for a consolidated capture directory, thecap_idreturned is 0). -
Using the
cap_idthat was returned by theGET_REPLAY_INFOfunction, run a query to return the appropriaterep_idfor the latest replay of the workload. -
Call the
DBMS_WORKLOAD_REPLAY.REPORTfunction.The
REPORTfunction generates a report using therep_idthat was returned by theSELECTstatement.The
REPORTfunction uses the following parameters:-
The
replay_idrequired parameter specifies the directory that contains the workload replay for which the report will be generated. The directory should be a valid directory in the host system containing the workload replay. The value of this parameter should match therep_idreturned by the previous query. -
The
formatparameter required parameter specifies the report format. Valid values includeDBMS_WORKLOAD_REPLAY.TYPE_TEXT,DBMS_WORKLOAD_REPLAY.TYPE_HTML, andDBMS_WORKLOAD_REPLAY.TYPE_XML.
-
In this example, the GET_REPLAY_INFO function retrieves all information about the workload captures and the history of all the workload replay attempts from the jul14 replay directory object. The function returns the cap_id of the capture directory, which can be associated with the CAPTURE_ID column in the DBA_WORKLOAD_REPLAYS view to access the information retrieved.The SELECT statement returns the appropriate rep_id for the latest replay of the workload. The REPORT function then generates a HTML report using the rep_id that was returned by the SELECT statement.
DECLARE
  cap_id         NUMBER;
  rep_id         NUMBER;
  rep_rpt        CLOB;
BEGIN
  cap_id := DBMS_WORKLOAD_REPLAY.GET_REPLAY_INFO(replay_dir => 'jul14');
  /* Get the latest replay for that capture */
  SELECT max(id)
  INTO   rep_id
  FROM   dba_workload_replays
  WHERE  capture_id = cap_id;

  rep_rpt := DBMS_WORKLOAD_REPLAY.REPORT(replay_id => rep_id,
                           format => DBMS_WORKLOAD_REPLAY.TYPE_HTML);
END;
/
See Also:
-
"Reviewing Workload Replay Reports" for information about how to interpret the workload replay report
-
Oracle Database PL/SQL Packages and Types Reference for information about the
DBMS_WORKLOAD_REPLAYpackage
13.2.3 Reviewing Workload Replay Reports
Performance divergence may result when new algorithms are introduced in the replay system that affect the overall performance of the database. For example, if the workload is replayed on a newer version of Oracle Database, a new algorithm may cause specific requests to run faster, and the divergence will appear as a faster execution. In this case, this is a desirable divergence.
Data divergence occurs when the results of DML or SQL queries do not match results that were originally captured in the workload. For example, a SQL statement may return fewer rows during replay than those returned during capture.
Error divergence occurs when a replayed database call:
-
Encounters a new error that was not captured
-
Does not encounter an error that was captured
-
Encounters a different error from what was captured
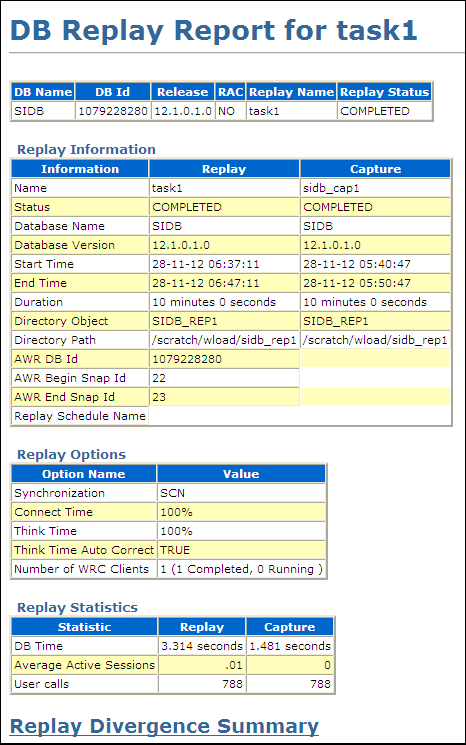
The information contained in the workload replay report is divided into the following categories:
-
Details about the workload replay and the workload capture, such as job name, status, database information, duration and time of each process, and the directory object and path
-
Replay options selected for the workload replay and the number of replay clients that were started
-
Overall statistics about the workload replay and the workload capture (such as the total DB time captured and replayed, and the number of logins and transactions captured and replayed) and the corresponding percentages with respect to total system activity
-
Profile of the replayed workload
-
Replay divergence
-
Error divergence
-
DML and SQL query data divergence
13.3 Using Replay Compare Period Reports
-
A workload replay to its workload capture
-
A workload replay to another replay of the same workload capture
-
Multiple workload captures to a consolidated replay
The following sections describe how to generate and review replay compare period reports:
See Also:
-
Using Consolidated Database Replay for information about Consolidated Database Replay
13.3.1 Generating Replay Compare Period Reports Using APIs
DBMS_WORKLOAD_REPLAY package. This report only compares workload replays that contain at least 5 minutes of database time.To generate replay compare period reports, use the DBMS_WORKLOAD_REPLAY.COMPARE_PERIOD_REPORT procedure:
BEGIN
  DBMS_WORKLOAD_REPLAY.COMPARE_PERIOD_REPORT (
                           replay_id1 => 12,
                           replay_id2 => 17,
                           format => DBMS_WORKLOAD_CAPTURE.TYPE_HTML,
                           result => :report_bind);
END;
/
In this example, the COMPARE_PERIOD_REPORT procedure generates a replay compare period report in HTML format that compares a workload replay with a replay ID of 12 with another replay with an ID of 17.
The COMPARE_PERIOD_REPORT procedure in this example uses the following parameters:
-
The
replay_id1parameter specifies the numerical identifier of the workload replay after change for which the reported will be generated. This parameter is required. -
The
replay_id2parameter specifies the numerical identifier of the workload replay before change for which the reported will be generated. If unspecified, the comparison will be performed with the workload capture. -
The
formatparameter specifies the report format. Valid values includeDBMS_WORKLOAD_CAPTURE.TYPE_HTMLfor HTML andDBMS_WORKLOAD_CAPTURE.TYPE_XMLfor XML. This parameter is required. -
The result parameter specifies the output of the report.
See Also:
-
"Reviewing Replay Compare Period Reports" for information about how to interpret the replay compare period report
-
Oracle Database PL/SQL Packages and Types Reference for information about the
DBMS_WORKLOAD_REPLAYpackage
13.3.2 Reviewing Replay Compare Period Reports
Reviewing replay compare period reports enables you to determine if any replay divergence occurred and whether there were any significant performance changes.
Depending on the type of comparison that is being made, one of three types of replay compare period reports is generated:
-
Capture vs. Replay
This report type compares the performance of a workload replay to its workload capture.
-
Replay vs. Replay
This report type compares the performance of two workload replays of the same workload capture.
-
Consolidated Replay
This report type compares the performance of multiple workload captures to a consolidated replay. Only the ASH Data Comparison section is available for this report type. For more information about this report type, see "Reporting and Analysis for Consolidated Database Replay".
All replay compare period report types contain information about the most important changes between the two runs that are being compared. Use this information to determine the appropriate action to take. For example, if a new concurrency issue is found, review Automatic Database Diagnostic Monitor (ADDM) reports to diagnose the issue. If a new SQL performance problem is found, run SQL Tuning Advisor to fix the problem.
The information in the replay compare period report is divided into the following sections:
13.3.2.1 General Information
init.ora parameter changes between the two runs are also shown here. Review this section to verify if the system change being tested was performed.13.3.2.2 Replay Divergence
This section contains the divergence analysis of the second run relative to the first. If the analysis shows significant divergence, review the full divergence report.
13.3.2.3 Main Performance Statistics
13.3.2.4 Top SQL/Call
13.3.2.5 Hardware Usage Comparison
This section compares CPU and I/O usage across the two runs. The number of CPUs is summed for all instances and CPU usage is averaged over instances.
I/O statistics are shown for data and temp files. A high value for the single block read time (much higher than 10 milliseconds) suggests that the system is I/O bound. If this is the case, then review the total read and write times to determine if the latency is caused by excessive I/O requests or poor I/O throughput.
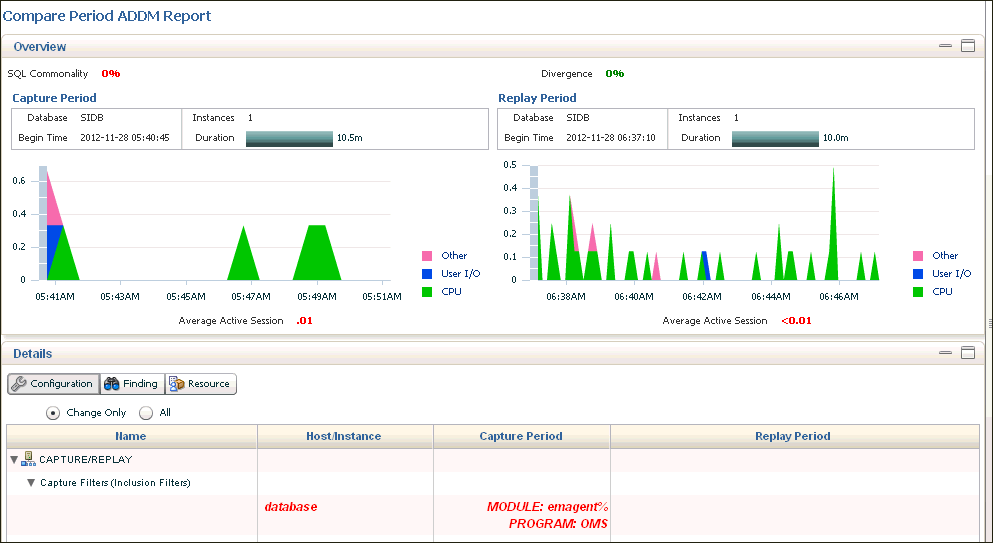
13.3.2.6 ADDM Comparison
See Also:
-
Oracle Database Performance Tuning Guide for information about ADDM analysis
13.3.2.7 ASH Data Comparison
The ASH Data Comparison section contains the following subsections:
See Also:
-
Oracle Database Performance Tuning Guide for information about ASH
13.3.2.7.1 Compare Summary
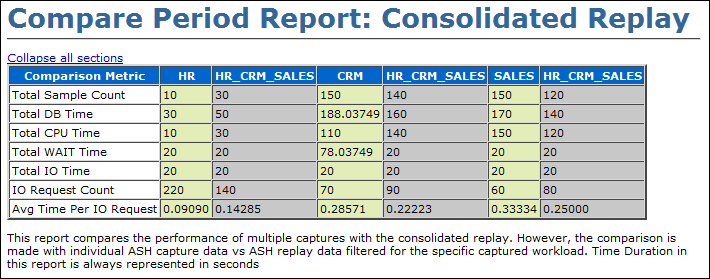
-
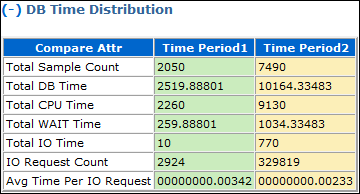
DB Time Distribution indicates how the total database time is distributed across CPU usage, wait times, and I/O requests.
Figure 13-1 shows the DB Time Distribution subsection of a sample report.
-
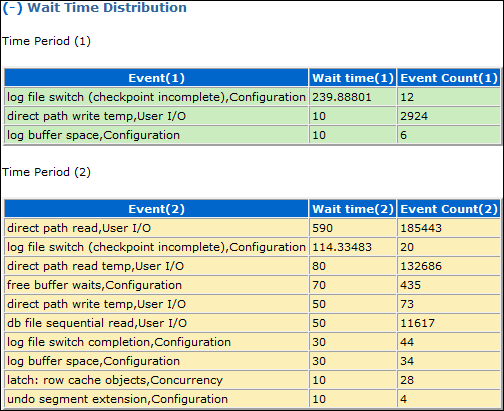
Wait Time Distribution indicates how the total wait time is distributed across wait events. The top wait event class, event name, and event count are listed for both runs.
Figure 13-2 shows the Wait Time Distribution subsection of a sample report.
13.3.2.7.2 Top SQL
This section displays the top SQL statements for both runs by total database time, CPU time, and wait time.
13.3.2.7.3 Long Running SQL
This section displays the top long-running SQL statements for both runs. Each long-running SQL statement contains details about the query, such as the maximum, minimum, and average response times.
13.3.2.7.4 Common SQL
This section extracts the SQL statements that are common in both runs and displays the top common SQL statements by variance in average response time and total database time.
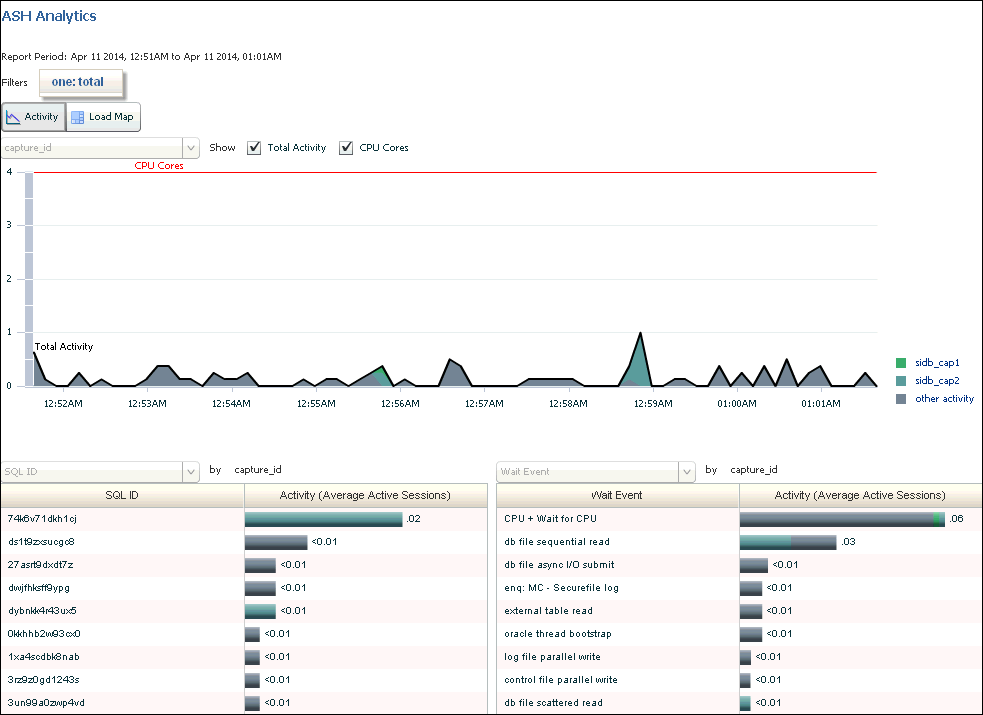
13.3.2.7.5 Top Objects
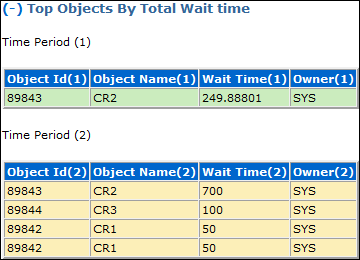
This section contains details about the top objects for both runs by total wait time.
Figure 13-3 shows the Top Objects section of a sample report.
13.4 Using SQL Performance Analyzer Reports
Use the SQL Performance Analyzer report to compare a SQL tuning set from a workload replay to another SQL tuning set from a workload capture, or two SQL tuning sets from two workload replays.
Comparing SQL tuning sets with Database Replay provides more information than SQL Performance Analyzer test-execute because it considers and shows all execution plans for each SQL statement, while SQL Performance Analyzer test-execute generates only one execution plan per SQL statement for each SQL trial.
13.4.1 Generating SQL Performance Analyzer Reports Using APIs
This section describes how to generate a SQL Performance Analyzer report using the DBMS_WORKLOAD_REPLAY package.
To generate a SQL Performance Analyzer report, use the DBMS_WORKLOAD_REPLAY.COMPARE_SQLSET_REPORT procedure:
BEGIN
  DBMS_WORKLOAD_REPLAY.COMPARE_SQLSET_REPORT (
                           replay_id1 => 12,
                           replay_id2 => 17,
                           format => DBMS_WORKLOAD_CAPTURE.TYPE_HTML,
                           result => :report_bind);
END;
/
In this example, the COMPARE_SQLSET_REPORT procedure generates a SQL Performance Analyzer report in HTML format that compares a SQL tuning set captured during the workload replay with a replay ID of 12 to a SQL tuning set captured during workload replay with an ID of 17.
The COMPARE_SQLSET_REPORT procedure in this example uses the following parameters:
-
The
replay_id1parameter specifies the numerical identifier of the workload replay after change for which the reported will be generated. This parameter is required. -
The
replay_id2parameter specifies the numerical identifier of the workload replay after change for which the reported will be generated. If unspecified, the comparison will be performed with the workload capture. -
The
formatparameter specifies the report format. Valid values includeDBMS_WORKLOAD_CAPTURE.TYPE_HTMLfor HTML,DBMS_WORKLOAD_CAPTURE.TYPE_XMLfor XML, andDBMS_WORKLOAD_CAPTURE.TYPE_TEXTfor text. This parameter is required. -
The result parameter specifies the output of the report.
See Also:
-
"Reviewing the SQL Performance Analyzer Report in Command-Line" for information about how to interpret the SQL Performance Analyzer report
-
Oracle Database PL/SQL Packages and Types Reference for information about the
DBMS_WORKLOAD_REPLAYpackage
